|
|
|
Der durchschnittliche
Eintrittspreis betrug 2013 £6,54 |
|
Woche 1
Woche 2
Woche 3
Woche 4
Woche 5
Woche 6
Woche 7
Woche 8
Woche 9
Woche 10
Woche 11
Woche 12
Woche 13 |
|
|
Die
erfolgreichsten Filme des I. Quartals 2013 |
|
Nr. |
Einspiel in Pfund |
Studio |
Titel |
| 1 |
40.656.176 |
U |
LES MISERABLES |
| 2 |
26.328.511 |
FOX |
Die Croods |
| 3 |
23.607.542 |
BV |
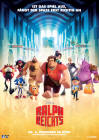
Ralph reicht's |
| 4 |
15.407.686 |
SON |
Django Unchained |
| 5 |
15.098.497 |
BV |
Die fantastische Welt von Oz |
| 6 |
13.040.823 |
EON |
The Impossible |
| 7 |
10.808.128 |
FOX |
Stirb langsam - Ein guter Tag zum Sterben |
| 8 |
8.463.390 |
FOX |
Lincoln |
| 9 |
8.397.780 |
MOM |
QUARTETT |
| 10 |
7.480.259 |
WB |
JACK AND THE GIANTS |
|
Ges. |
- |
- |
I. Quartal 2013 |
|
|
|
Wochenende 1: 4.1.2013 -
6.1.2013 |
|
|
Nr. |
Einspiel in
Pfund
Wochenende |
% |
Kinos |
Schnitt |
Einspiel in
Pfund
Gesamt |
Woche |
Studio |
Titel |
 |
1 |
4.075.781 |
-41 |
568 |
7.176 |
44.870.320 |
4 |
WB |
Der Hobbit |
|
2 |
4.034.470 |
--- |
372 |
10.846 |
4.034.470 |
1 |
EON |
The Impossible |
|
3 |
3.353.579 |
-20 |
566 |
5.926 |
17.857.428 |
3 |
FOX |
Life of Pi |
|
4 |
2.294.917 |
--- |
415 |
5.530 |
2.294.917 |
1 |
MOM |
Quartett |
|
5 |
1.682.561 |
-53 |
454 |
3.707 |
7.160.319 |
2 |
PAR |
Jack Reacher |
|
6 |
917.135 |
-29 |
359 |
2.555 |
4.928.013 |
3 |
U |
Pitch Perfect |
|
7 |
884.319 |
-32 |
432 |
2.048 |
3.371.022 |
2 |
FOX |
Die Bestimmer |
|
8 |
725.281 |
-29 |
489 |
1.484 |
11.247.265 |
6 |
PAR |
Die Hüter des Lichts |
| 9 |
541.401 |
-39 |
253 |
2.140 |
101.572.493 |
11 |
SON |
Skyfall |
| 10 |
516.952 |
-17 |
399 |
1.296 |
3.375.684 |
4 |
BV |
Das Geheimnis der Feenflügel |
| |
Ges. |
19.026.396 |
-7 |
4.307 |
4.418 |
|
1 |
- |
Woche 1 |
|
|
Wochenende 2: 11.1.2013 -
13.1.2013 |
|
|
Nr. |
Einspiel in
Pfund
Wochenende |
% |
Kinos |
Schnitt |
Einspiel in
Pfund
Gesamt |
Woche |
Studio |
Titel |
 |
1 |
8.127.991 |
--- |
589 |
13.800 |
8.127.991 |
1 |
U |
Les Miserables |
|
2 |
2.339.593 |
-30 |
499 |
4.689 |
21.918.556 |
4 |
FOX |
Life of Pi |
|
3 |
2.090.614 |
--- |
436 |
4.795 |
2.090.614 |
1 |
WB |
Gangster Squad |
|
4 |
1.861.157 |
-54 |
480 |
3.878 |
48.487.556 |
5 |
WB |
Der Hobbit |
|
5 |
1.859.505 |
-54 |
378 |
4.920 |
7.153.642 |
2 |
EON |
The Impossible |
|
6 |
1.247.375 |
--- |
284 |
4.394 |
1.247.735 |
1 |
LG |
Texas Chainsaw |
|
7 |
891.829 |
-61 |
408 |
2.186 |
4.717.247 |
2 |
MOM |
Quartett |
|
8 |
690.043 |
-59 |
383 |
1.802 |
8.611.737 |
3 |
PAR |
Jack Reacher |
| 9 |
453.205 |
-51 |
317 |
1.430 |
5.776.203 |
4 |
U |
Pitch Perfect |
| 10 |
401.627 |
-55 |
385 |
1.044 |
3.972.818 |
3 |
FOX |
Die Bestimmer |
| |
Ges. |
19.962.939 |
+5 |
4.159 |
4.800 |
|
2 |
- |
Woche 2 |
|
|
Wochenende 3: 18.1.2013 -
20.1.2013 |
|
|
Nr. |
Einspiel in
Pfund
Wochenende |
% |
Kinos |
Schnitt |
Einspiel in
Pfund
Gesamt |
Woche |
Studio |
Titel |
|
|
1 |
4.406.828 |
-46 |
599 |
7.357 |
17.360.303 |
2 |
U |
Les Miserables |
|
2 |
2.801.312 |
--- |
445 |
6.295 |
2.801.312 |
1 |
SON |
Django Unchained |
|
3 |
1.201.163 |
-49 |
480 |
2.502 |
24.147.499 |
5 |
FOX |
Life of Pi |
|
4 |
1.094.321 |
-41 |
399 |
2.743 |
9.120.400 |
3 |
EON |
The Impossible |
|
5 |
791.799 |
-62 |
417 |
1.899 |
3.890.342 |
2 |
WB |
Gangster Squad |
|
6 |
765.437 |
-59 |
442 |
1.732 |
49.997.203 |
6 |
WB |
Der Hobbit |
|
7 |
681.247 |
--- |
358 |
1.903 |
681.247 |
1 |
BV |
Die Monster AG 3D |
|
8 |
355.518 |
-60 |
407 |
874 |
5.904.503 |
3 |
MOM |
Quartett |
| 9 |
212.540 |
-69 |
264 |
805 |
9.126.695 |
4 |
PAR |
Jack Reacher |
| 10 |
206.060 |
-49 |
354 |
582 |
4.224.758 |
4 |
FOX |
Die Bestimmer |
| |
Ges. |
12.516.225 |
-37 |
4.165 |
3.005 |
|
3 |
- |
Woche 3 |
|
|
Wochenende 4: 25.1.2013 -
27.1.2013 |
|
|
Nr. |
Einspiel in
Pfund
Wochenende |
% |
Kinos |
Schnitt |
Einspiel in
Pfund
Gesamt |
Woche |
Studio |
Titel |
|
|
1 |
4.016.611 |
-9 |
591 |
6.797 |
24.618.896 |
3 |
U |
Les Miserables |
|
2 |
2.419.846 |
-14 |
458 |
5.284 |
7.185.499 |
2 |
SON |
Django Unchained |
|
3 |
1.657.337 |
--- |
472 |
3.512 |
1.657.337 |
1 |
FOX |
Lincoln |
|
4 |
1.119.570 |
-7 |
432 |
2.592 |
25.957.044 |
6 |
FOX |
Life of Pi |
|
5 |
1.052.845 |
--- |
434 |
2.426 |
1.052.845 |
1 |
U |
Zero Dark Thirty |
|
6 |
1.006.477 |
-8 |
394 |
2.555 |
10.777.332 |
4 |
EON |
The Impossible |
|
7 |
787.648 |
--- |
274 |
2.875 |
787.648 |
1 |
MOM |
Movie 43 |
|
8 |
703.656 |
+3 |
375 |
1.877 |
1.595.962 |
2 |
BV |
Die Monster AG 3D |
| 9 |
623.889 |
-18 |
335 |
1.863 |
51.020.811 |
7 |
WB |
Der Hobbit |
| 10 |
538.867 |
--- |
356 |
1.514 |
538.867 |
1 |
LG |
The Last Stand |
| |
Ges. |
13.926.746 |
+11 |
4.121 |
3.379 |
|
4 |
- |
Woche 4 |
|
|
Wochenende 5: 1.2.2013 -
3.2.2013 |
|
|
Nr. |
Einspiel in
Pfund
Wochenende |
% |
Kinos |
Schnitt |
Einspiel in
Pfund
Gesamt |
Woche |
Studio |
Titel |
|
|
1 |
2.785.143 |
-31 |
562 |
4.956 |
30.137.493 |
4 |
U |
Les Miserables |
|
2 |
1.696.391 |
-30 |
457 |
3.713 |
10.308.028 |
3 |
SON |
Django Unchained |
|
3 |
1.401.214 |
--- |
387 |
3.621 |
1.401.214 |
1 |
PAR |
Flight |
|
4 |
1.377.588 |
-17 |
503 |
2.739 |
4.239.010 |
2 |
FOX |
Lincoln |
|
5 |
848.579 |
-24 |
405 |
2.096 |
27.308.038 |
7 |
FOX |
Life of Pi |
|
6 |
758.024 |
-25 |
372 |
2.038 |
12.052.177 |
5 |
EON |
The Impossible |
|
7 |
655.689 |
-38 |
439 |
1.494 |
2.355.578 |
2 |
U |
Zero Dark Thirty |
|
8 |
485.160 |
-31 |
383 |
1.267 |
2.197.372 |
3 |
BV |
Die Monster AG 3D |
| 9 |
429.317 |
--- |
298 |
1.441 |
429.317 |
1 |
EON |
Shootout |
| 10 |
396.833 |
-50 |
272 |
1.459 |
1.581.864 |
2 |
MOM |
Movie 43 |
| |
Ges. |
10.833.938 |
-22 |
4.078 |
2.657 |
|
5 |
- |
Woche 5 |
|
|
Wochenende 6: 8.2.2013 -
10.2.2013 |
|
|
Nr. |
Einspiel in
Pfund
Wochenende |
% |
Kinos |
Schnitt |
Einspiel in
Pfund
Gesamt |
Woche |
Studio |
Titel |
 |
1 |
4.526.380 |
--- |
501 |
9.035 |
4.526.380 |
1 |
BV |
Ralph reicht's |
|
2 |
1.640.857 |
-41 |
514 |
3.193 |
33.456.340 |
5 |
U |
Les Miserables |
|
3 |
1.450.023 |
--- |
396 |
3.662 |
1.450.023 |
1 |
SC |
Das hält kein Jahr! |
|
4 |
1.073.775 |
-37 |
404 |
2.658 |
12.407.764 |
4 |
SON |
Django Unchained |
|
5 |
925.049 |
-34 |
387 |
2.391 |
3.186.967 |
2 |
PAR |
Flight |
|
6 |
895.509 |
--- |
315 |
2.843 |
895.509 |
1 |
EON |
Warm Bodies |
|
7 |
809.196 |
-41 |
434 |
1.865 |
5.916.579 |
3 |
FOX |
Lincoln |
|
8 |
606.817 |
--- |
382 |
1.589 |
606.817 |
1 |
FOX |
Hitchcock |
| 9 |
462.559 |
-45 |
316 |
1.464 |
28.098.112 |
8 |
FOX |
Life of Pi |
| 10 |
351.193 |
-54 |
263 |
1.336 |
12.751.395 |
6 |
EON |
The Impossible |
| |
Ges. |
12.741.358 |
+18 |
3.912 |
3.257 |
|
6 |
- |
Woche 6 |
|
|
Wochenende 7: 15.2.2013 -
17.2.2013 |
|
|
Nr. |
Einspiel in
Pfund
Wochenende |
% |
Kinos |
Schnitt |
Einspiel in
Pfund
Gesamt |
Woche |
Studio |
Titel |
 |
1 |
4.551.116 |
--- |
484 |
9.404 |
4.551.116 |
1 |
FOX |
Stirb langsam 5 |
|
2 |
3.436.400 |
-24 |
543 |
6.329 |
10.516.665 |
2 |
BV |
Ralph reicht's |
|
3 |
1.229.352 |
--- |
386 |
3.185 |
1.229.352 |
1 |
U |
Immer Ärger mit 40 |
|
4 |
1.126.168 |
-31 |
426 |
2.644 |
35.968.027 |
6 |
U |
Les Miserables |
|
5 |
1.109.167 |
--- |
423 |
2.623 |
1.109.167 |
1 |
ENT |
Beautiful Creatures |
|
6 |
1.014.707 |
-30 |
403 |
2.518 |
3.685.804 |
2 |
SC |
Das hält kein Jahr! |
|
7 |
685.389 |
-36 |
322 |
2.129 |
13.707.266 |
5 |
SON |
Django Unchained |
|
8 |
519.049 |
--- |
380 |
1.366 |
519.049 |
1 |
WB |
Sammys Abenteuer |
| 9 |
483.397 |
-40 |
299 |
1.617 |
6.964.023 |
4 |
FOX |
Lincoln |
| 10 |
472.983 |
-49 |
316 |
1.497 |
4.181.690 |
3 |
PAR |
Flight |
| |
Ges. |
14.627.728 |
+15 |
3.982 |
2.581 |
|
7 |
- |
Woche 7 |
|
|
Wochenende 8: 22.2.2013 -
24.2.2013 |
|
|
Nr. |
Einspiel in
Pfund
Wochenende |
% |
Kinos |
Schnitt |
Einspiel in
Pfund
Gesamt |
Woche |
Studio |
Titel |
|
|
1 |
3.420.196 |
-0 |
540 |
6.334 |
18.624.692 |
3 |
BV |
Ralph reicht's |
|
2 |
1.646.541 |
-64 |
491 |
3.354 |
8.192.198 |
2 |
FOX |
Stirb langsam 5 |
|
3 |
1.512.297 |
--- |
392 |
3.858 |
1.512.297 |
1 |
U |
Mama |
|
4 |
765.367 |
-32 |
398 |
1.924 |
37.804.139 |
7 |
U |
Les Miserables |
|
5 |
632.195 |
-38 |
368 |
1.718 |
5.084.998 |
3 |
SC |
Das hält kein Jahr! |
|
6 |
544.725 |
--- |
290 |
1.879 |
544.725 |
1 |
WB |
Cloud Atlas |
|
7 |
473.915 |
-61 |
369 |
1.285 |
2.288.475 |
2 |
U |
Immer Ärger mit 40 |
|
8 |
456.714 |
--- |
301 |
1.518 |
456.714 |
1 |
EON |
Song for Marion |
| 9 |
427.027 |
-38 |
271 |
1.576 |
14.541.950 |
6 |
SON |
Django Unchained |
| 10 |
398.401 |
-64 |
418 |
954 |
2.170.260 |
2 |
ENT |
Beautiful Creatures |
| |
Ges. |
10.277.378 |
-30 |
3.838 |
6.516 |
|
8 |
- |
Woche 8 |
|
|
Wochenende 9: 1.3.2013 -
3.3.2013 |
|
|
Nr. |
Einspiel in
Pfund
Wochenende |
% |
Kinos |
Schnitt |
Einspiel in
Pfund
Gesamt |
Woche |
Studio |
Titel |
 |
1 |
1.502.782 |
--- |
404 |
3.720 |
1.502.782 |
1 |
PAR |
Hänsel & Gretel - Hexenjäger |
|
2 |
1.402.000 |
-59 |
529 |
2.651 |
20.432.173 |
4 |
BV |
Ralph reicht's |
|
3 |
1.066.008 |
-30 |
399 |
2.672 |
3.484.674 |
2 |
U |
Mama |
|
4 |
823.723 |
-50 |
433 |
1.903 |
9.711.292 |
3 |
FOX |
Stirb langsam 5 |
|
5 |
812.460 |
--- |
388 |
2.094 |
812.460 |
1 |
MOM |
Safe Haven |
|
6 |
503.161 |
-34 |
368 |
1.368 |
38.884.766 |
8 |
U |
Les Miserables |
|
7 |
499.283 |
--- |
317 |
1.576 |
499.283 |
1 |
SC |
Broken City |
|
8 |
408.903 |
+72 |
257 |
1.592 |
7.065.703 |
17 |
WB |
Argo |
| 9 |
402.873 |
--- |
214 |
1.883 |
402.873 |
1 |
KOC |
Arbitrage |
| 10 |
367.509 |
--- |
261 |
1.409 |
367.509 |
1 |
FOX |
Stoker |
| |
Ges. |
7.788.702 |
-24 |
3.570 |
2.182 |
|
9 |
- |
Woche 9 |
|
|
Wochenende 10: 8.3.2013 -
10.3.2013 |
|
|
Nr. |
Einspiel in
Pfund
Wochenende |
% |
Kinos |
Schnitt |
Einspiel in
Pfund
Gesamt |
Woche |
Studio |
Titel |
 |
1 |
3.712.948 |
--- |
530 |
7.006 |
3.712.948 |
1 |
BV |
Die fantastische Welt von Oz |
|
2 |
904.746 |
--- |
351 |
2.578 |
904.746 |
1 |
EON |
Side Effects |
|
3 |
744.683 |
-47 |
503 |
1.481 |
21.459.657 |
5 |
BV |
Ralph reicht's |
|
4 |
568.777 |
--- |
301 |
1.890 |
568.777 |
1 |
EON |
Parker |
|
5 |
525.672 |
-51 |
373 |
1.410 |
4.530.295 |
3 |
U |
Mama |
|
6 |
507.759 |
-66 |
403 |
1.260 |
2.651.393 |
2 |
PAR |
Hänsel & Gretel - Hexenjäger |
|
7 |
432.068 |
--- |
316 |
1.368 |
432.068 |
1 |
PAR |
Unterwegs mit Mum |
|
8 |
407.293 |
-50 |
388 |
1.050 |
1.689.566 |
2 |
MOM |
Safe Haven |
| 9 |
342.415 |
-58 |
321 |
1.067 |
10.401.957 |
4 |
FOX |
Stirb langsam 5 |
| 10 |
293.893 |
-42 |
278 |
1.058 |
39.552.600 |
9 |
U |
Les Miserables |
| |
Ges. |
8.440.254 |
+8 |
3.764 |
2.242 |
|
10 |
- |
Woche 10 |
|
|
Wochenende 11: 15.3.2013
- 17.3.2013 |
|
|
Nr. |
Einspiel in
Pfund
Wochenende |
% |
Kinos |
Schnitt |
Einspiel in
Pfund
Gesamt |
Woche |
Studio |
Titel |
|
|
1 |
2.609.475 |
-30 |
539 |
4.842 |
7.683.699 |
2 |
BV |
Die fantastische Welt von Oz |
|
2 |
759.363 |
-16 |
371 |
2.047 |
2.277.861 |
2 |
EON |
Side Effects |
|
3 |
460.250 |
--- |
370 |
1.244 |
460.250 |
1 |
MOM |
Welcome to the Punch |
|
4 |
426.343 |
-43 |
458 |
931 |
21.995.949 |
6 |
BV |
Ralph reicht's |
|
5 |
308.335 |
-46 |
276 |
1.118 |
1.229.889 |
2 |
EON |
Parker |
|
6 |
305.936 |
--- |
386 |
793 |
305.936 |
1 |
WB |
Der unglaubliche Burt Wonderstone |
|
7 |
266.521 |
-49 |
299 |
892 |
5.054.683 |
4 |
U |
Mama |
|
8 |
255.448 |
--- |
341 |
750 |
255.448 |
1 |
KOC |
Red Dawn |
| 9 |
221.452 |
-56 |
270 |
821 |
3.178.317 |
3 |
PAR |
Hänsel & Gretel - Hexenjäger |
| 10 |
157.016 |
-64 |
284 |
553 |
814.530 |
2 |
PAR |
Unterwegs mit Mum |
| |
Ges. |
5.770.139 |
-32 |
3.594 |
1.605 |
|
11 |
- |
Woche 11 |
|
|
Wochenende 12: 22.3.2013
- 24.3.2013 |
|
|
Nr. |
Einspiel in
Pfund
Wochenende |
% |
Kinos |
Schnitt |
Einspiel in
Pfund
Gesamt |
Woche |
Studio |
Titel |
 |
1 |
5.372.290 |
--- |
521 |
10.312 |
5.372.290 |
1 |
FOX |
Die Croods |
|
2 |
1.591.736 |
--- |
467 |
3.409 |
1.591.736 |
1 |
WB |
Jack and the Giants |
|
3 |
1.345.135 |
-48 |
521 |
2.582 |
10.085.578 |
3 |
BV |
Die fantastische Welt von Oz |
|
4 |
1.313.162 |
--- |
440 |
2.985 |
1.313.162 |
1 |
U |
Voll abgezockt |
|
5 |
609.406 |
-20 |
369 |
1.652 |
3.400.378 |
3 |
EON |
Side Effects |
|
6 |
236.580 |
-45 |
399 |
593 |
22.329.961 |
7 |
BV |
Ralph reicht's |
|
7 |
202.373 |
--- |
187 |
1.083 |
202.373 |
1 |
LG |
Stolen |
|
8 |
194.861 |
-58 |
334 |
584 |
974.862 |
2 |
MOM |
Welcome to the Punch |
| 9 |
137.027 |
-56 |
174 |
788 |
1.578.781 |
3 |
EON |
Parker |
| 10 |
111.739 |
-58 |
170 |
658 |
5.321.101 |
5 |
U |
Mama |
| |
Ges. |
11.114.309 |
+93 |
3.582 |
3.103 |
|
12 |
- |
Woche 12 |
|
|
Wochenende 13: 29.3.2013
- 31.3.2013 |
|
|
Nr. |
Einspiel in
Pfund
Wochenende |
% |
Kinos |
Schnitt |
Einspiel in
Pfund
Gesamt |
Woche |
Studio |
Titel |
|
|
1 |
3.305.642 |
-38 |
535 |
6.179 |
10.617.230 |
2 |
FOX |
Die Croods |
|
2 |
2.792.861 |
--- |
419 |
6.666 |
2.792.861 |
1 |
PAR |
G.I. Joe II |
|
3 |
1.592.339 |
--- |
408 |
3.903 |
1.592.339 |
1 |
FOX |
Trance |
|
4 |
1.236.126 |
-22 |
484 |
2.554 |
3.790.693 |
2 |
WB |
Jack and the Giants |
|
5 |
991.017 |
--- |
432 |
2.295 |
991.017 |
1 |
ENT |
Seelen |
|
6 |
975.577 |
-27 |
519 |
1.880 |
11.865.344 |
4 |
BV |
Die fantastische Welt von Oz |
|
7 |
767.504 |
-42 |
441 |
1.741 |
2.943.305 |
2 |
U |
Voll abgezockt |
|
8 |
346.620 |
-43 |
291 |
1.192 |
4.111.568 |
4 |
EON |
Side Effects |
| 9 |
264.779 |
--- |
327 |
810 |
264.779 |
1 |
BV |
Findet Nemo |
| 10 |
209.431 |
--- |
80 |
2.618 |
209.431 |
1 |
MOM |
In ihrem Haus |
| |
Ges. |
12.481.896 |
+12 |
3.936 |
251 |
|
13 |
- |
Woche 13 |
|
|
|